Smooth line plots
3 minute read
W&B supports several types of smoothing:
- Time weighted exponential moving average (TWEMA) smoothing
- Gaussian smoothing
- Running average
- Exponential moving average (EMA) smoothing
See these live in an interactive W&B report.
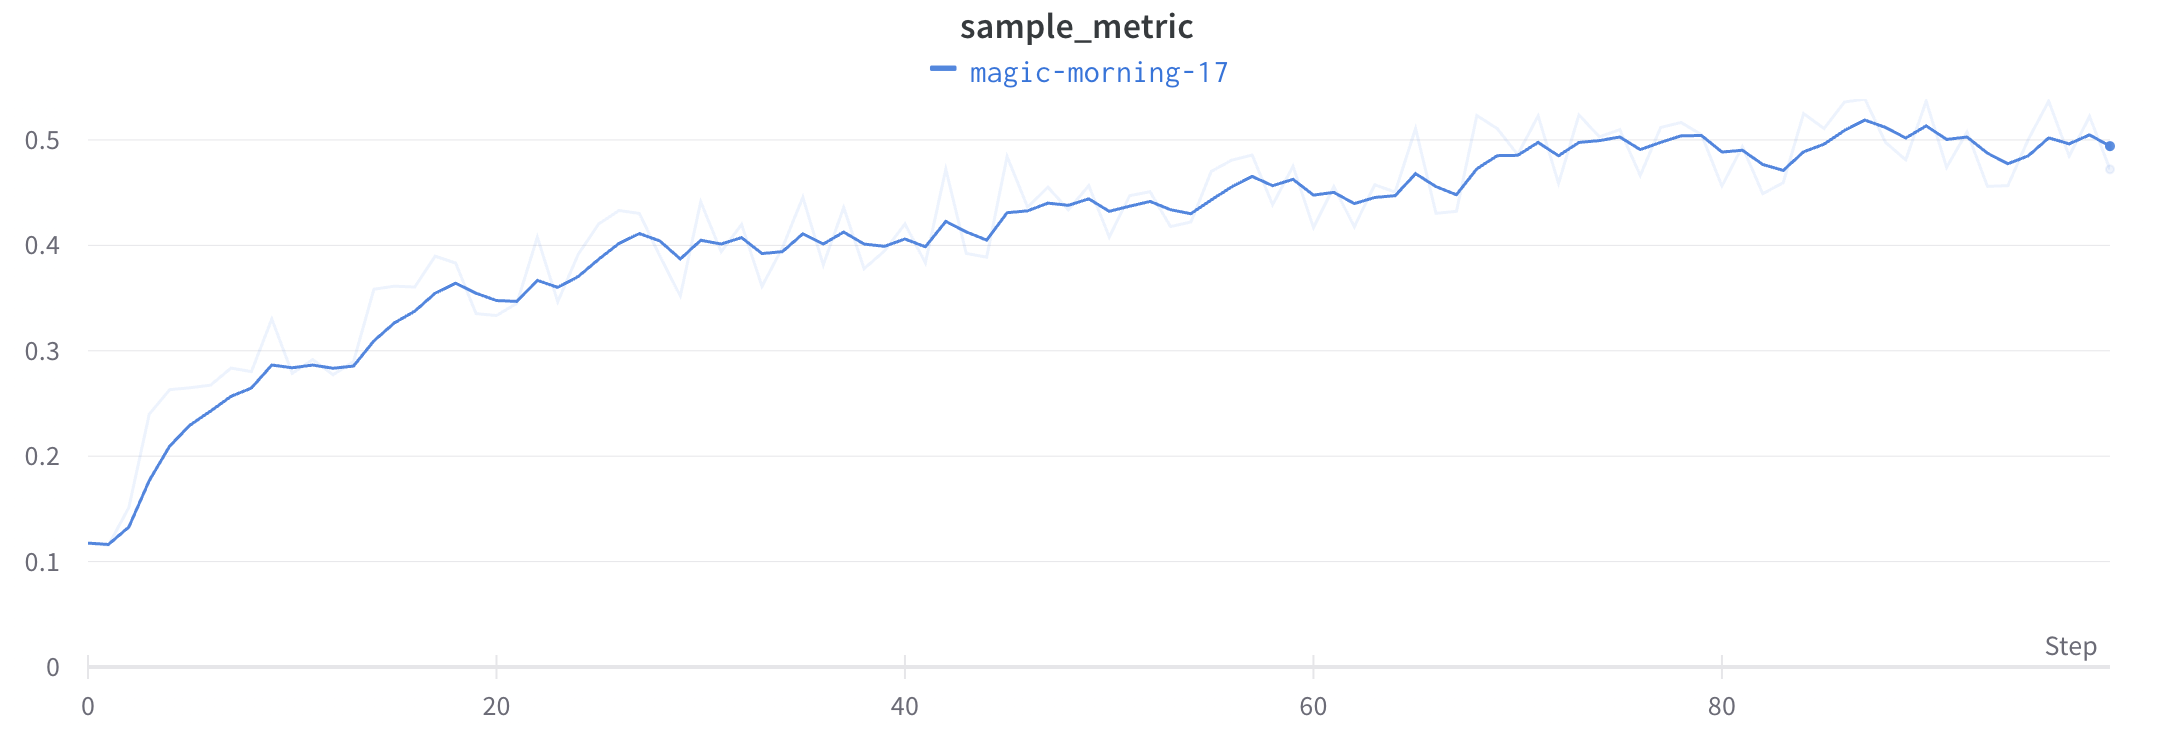
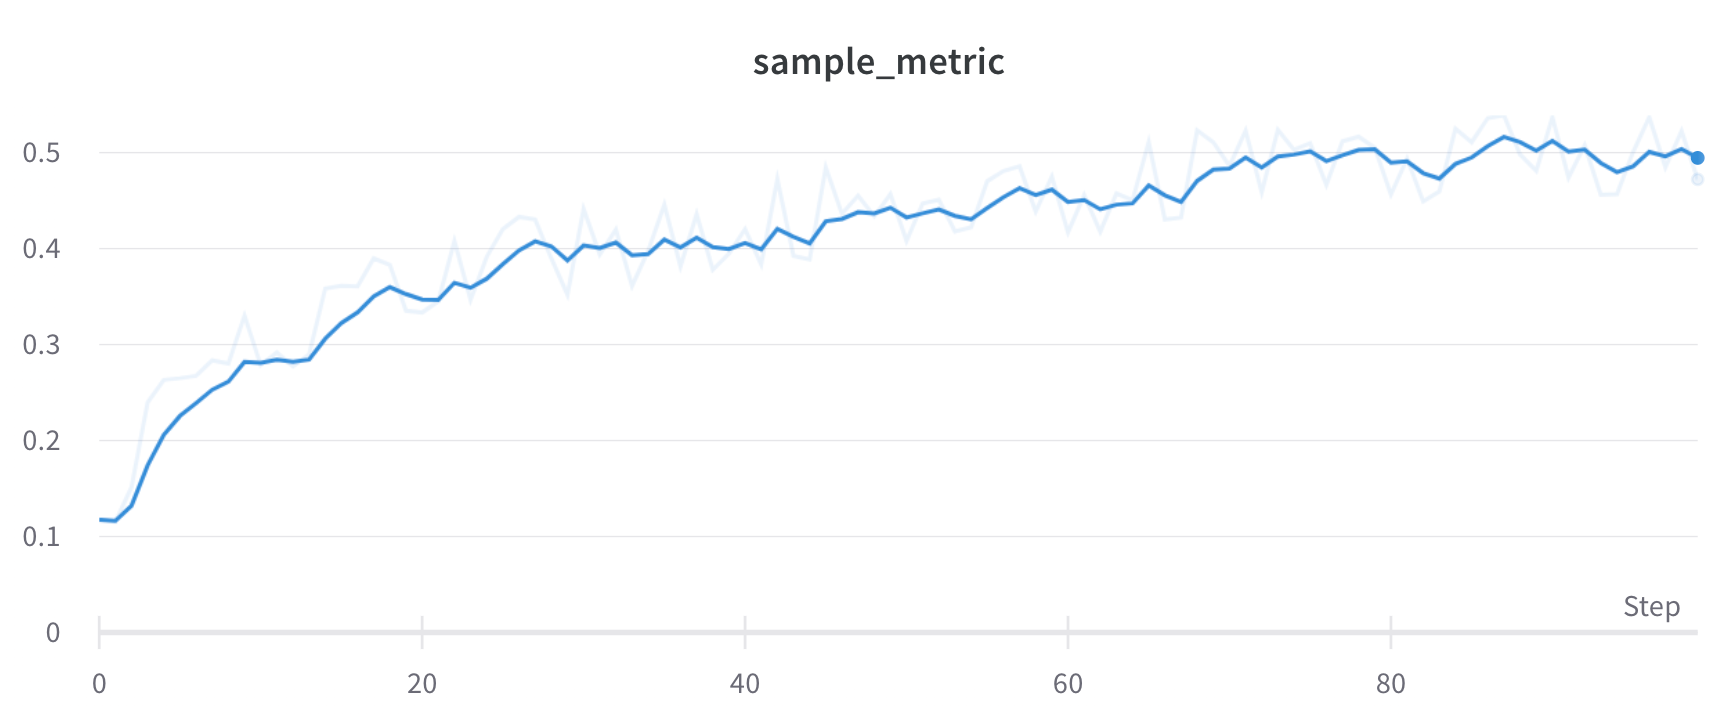
Time Weighted Exponential Moving Average (TWEMA) smoothing (Default)
The Time Weighted Exponential Moving Average (TWEMA) smoothing algorithm is a technique for smoothing time series data by exponentially decaying the weight of previous points. For details about the technique, see Exponential Smoothing. The range is 0 to 1. There is a de-bias term added so that early values in the time series are not biased towards zero.
The TWEMA algorithm takes the density of points on the line (the number of y values per unit of range on x-axis) into account. This allows consistent smoothing when displaying multiple lines with different characteristics simultaneously.
Here is sample code for how this works under the hood:
const smoothingWeight = Math.min(Math.sqrt(smoothingParam || 0), 0.999);
let lastY = yValues.length > 0 ? 0 : NaN;
let debiasWeight = 0;

return yValues.map((yPoint, index) => {
  const prevX = index > 0 ? index - 1 : 0;
  // VIEWPORT_SCALE scales the result to the chart's x-axis range
  const changeInX =
    ((xValues[index] - xValues[prevX]) / rangeOfX) * VIEWPORT_SCALE;
  const smoothingWeightAdj = Math.pow(smoothingWeight, changeInX);

  lastY = lastY * smoothingWeightAdj + yPoint;
  debiasWeight = debiasWeight * smoothingWeightAdj + 1;
  return lastY / debiasWeight;
});
Here’s what this looks like in the app:
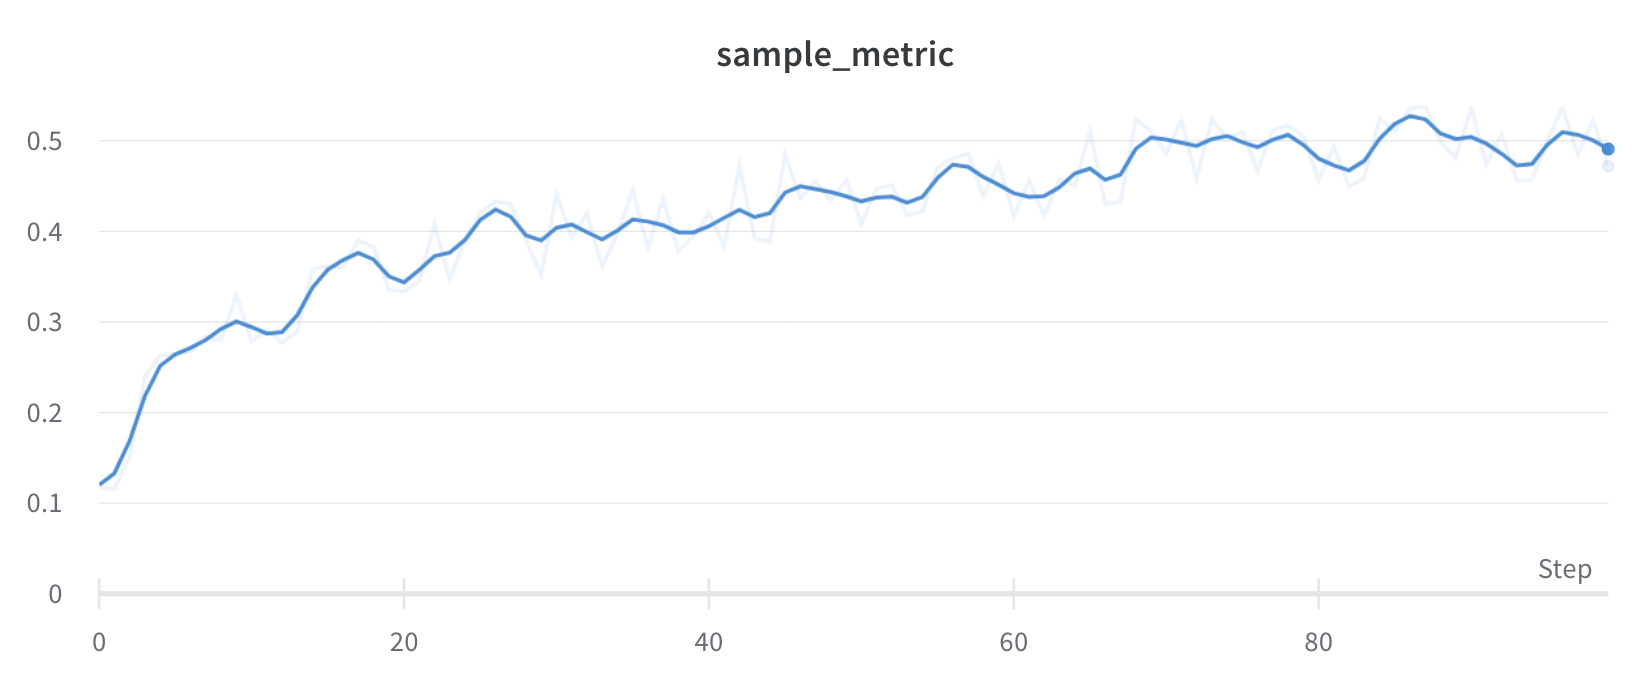
Gaussian smoothing
Gaussian smoothing (or Gaussian kernel smoothing) computes a weighted average of the points, where the weights correspond to a gaussian distribution with the standard deviation specified as the smoothing parameter. The smoothed value is calculated for every input x value, based on the points occurring both before and after it.
Here’s what this looks like in the app:
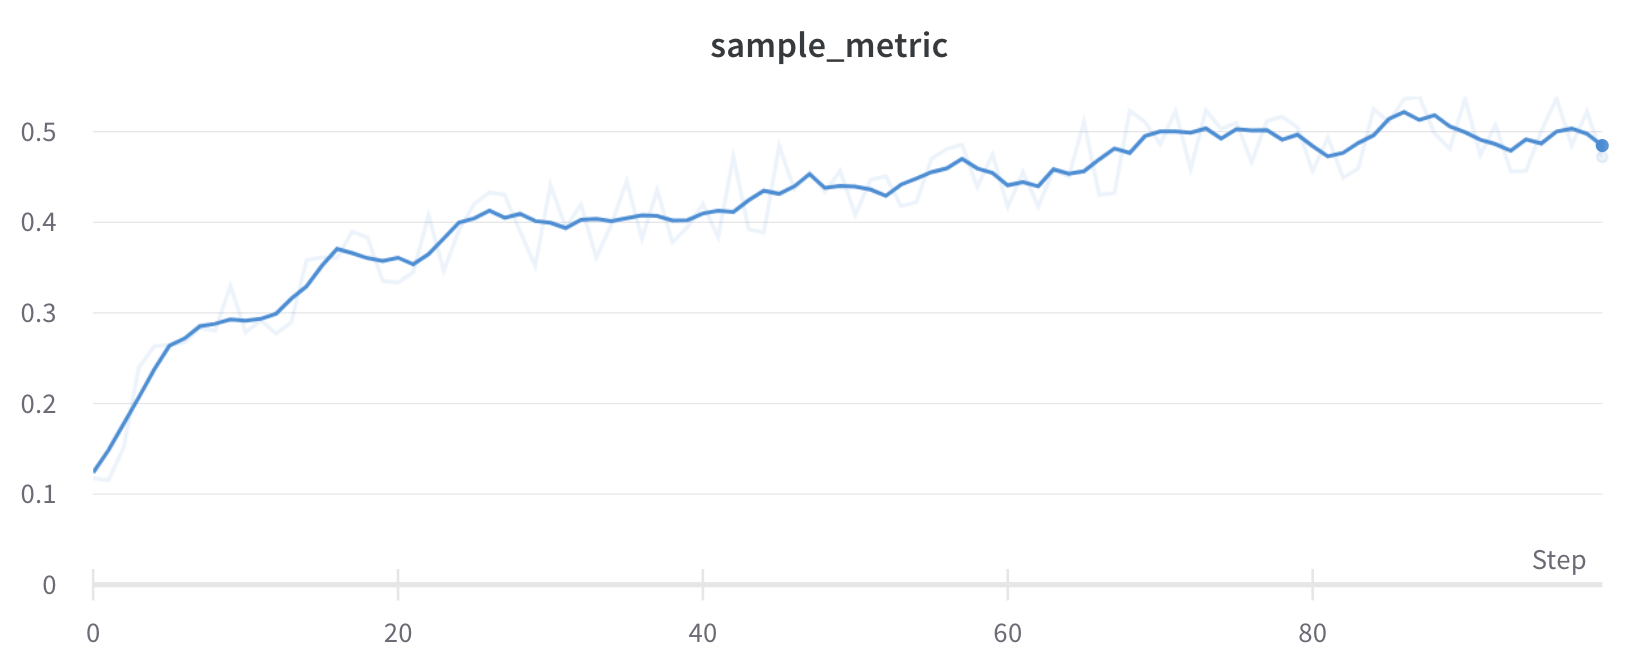
Running average smoothing
Running average is a smoothing algorithm that replaces a point with the average of points in a window before and after the given x value. See “Boxcar Filter” at https://en.wikipedia.org/wiki/Moving_average. The selected parameter for running average tells Weights and Biases the number of points to consider in the moving average.
Consider using Gaussian Smoothing instead if your points are spaced unevenly on the x-axis.
Here’s what this looks like in the app:
Exponential Moving Average (EMA) smoothing
The Exponential Moving Average (EMA) smoothing algorithm is a rule of thumb technique for smoothing time series data using the exponential window function. For details about the technique, see Exponential Smoothing. The range is 0 to 1. A debias term is added so that early values in the time series are not biases towards zero.
In many situations, EMA smoothing is applied to a full scan of history, rather than bucketing first before smoothing. This often produces more accurate smoothing.
In the following situations, EMA smoothing is after bucketing instead:
- Sampling
- Grouping
- Expressions
- Non-monotonic x-axes
- Time-based x-axes
Here is sample code for how this works under the hood:
  data.forEach(d => {
    const nextVal = d;
    last = last * smoothingWeight + (1 - smoothingWeight) * nextVal;
    numAccum++;
    debiasWeight = 1.0 - Math.pow(smoothingWeight, numAccum);
    smoothedData.push(last / debiasWeight);
Here’s what this looks like in the app:
Hide original data
By default, the original unsmoothed data displays in the plot as a faint line in the background. Click Show Original to turn this off.
Feedback
Was this page helpful?
Glad to hear it! If you have further feedback, please let us know.
Sorry to hear that. Please tell us how we can improve.